 Secure Payment
 Free shipping on orders over €60 (UE)
 Financing on orders +60 €
 Hassle-free returns
Analyze the difficulty of your Route
Tips for detailed and precise analysis
Once I have the route ready, I always like to do a small analysis to have the route clear and, if I'm going in a group, I can provide data to the rest of the team.
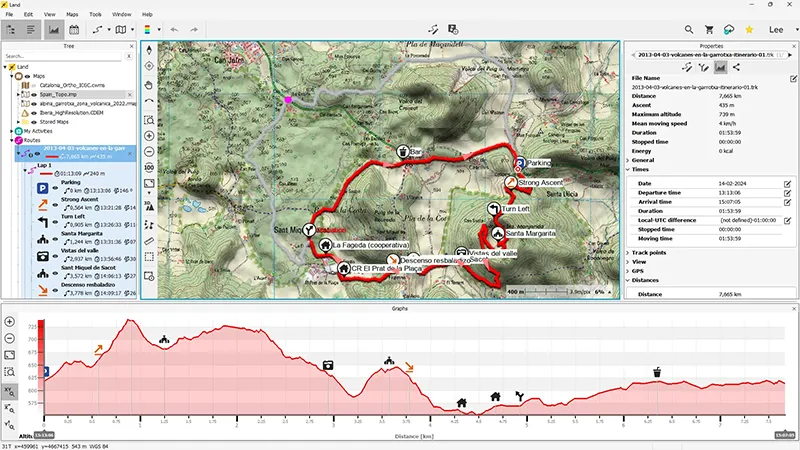
So, to analyze the route, we open the properties window and select the route. It's important to have activated the variant we want to analyze the data for.
Long variant
These are the data for the long variant, the one I plan to travel: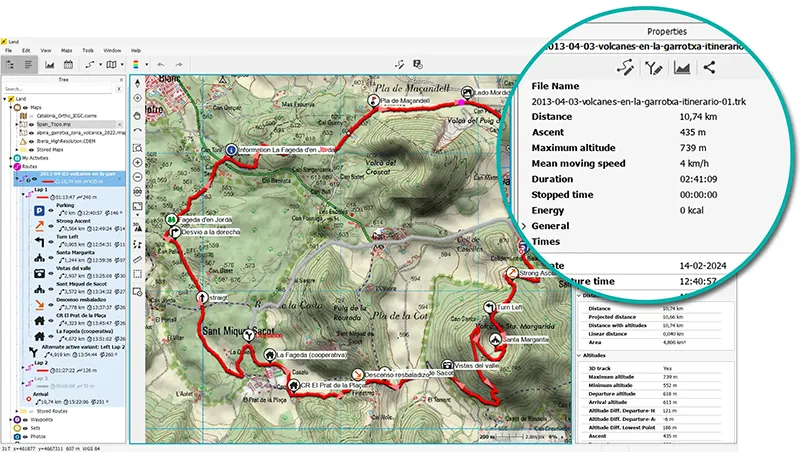
Distance: 10.74 km
Elevation Gain: 435 m
Maximum Altitude: 739 m
Speed: 4 km/h
Time: 2:41 min
One thing to keep in mind when downloading a pre-made route is that the speed and time data come from the original route, but we have modified the route. So these data will not be entirely correct, so to get a clearer idea, we must manually modify the speed. In this example, I've set an average speed of 4 km/h.
How do we do it? Simply right-click on
the track and select 'Tools > Assign Time and Speed'
After applying this modification, Land 9 gives us a time of 2:41 min, but beware! the 'Stopped Time' field is 0 min, so we must add a margin of time to contemplate scenery, take photos, eat... I've added about 45 extra minutes. In total, it will take me approximately 3:30 min to complete this route. Add to your route the time you consider appropriate!
Short variant
These are the data for the short variant, an alternative to the main route: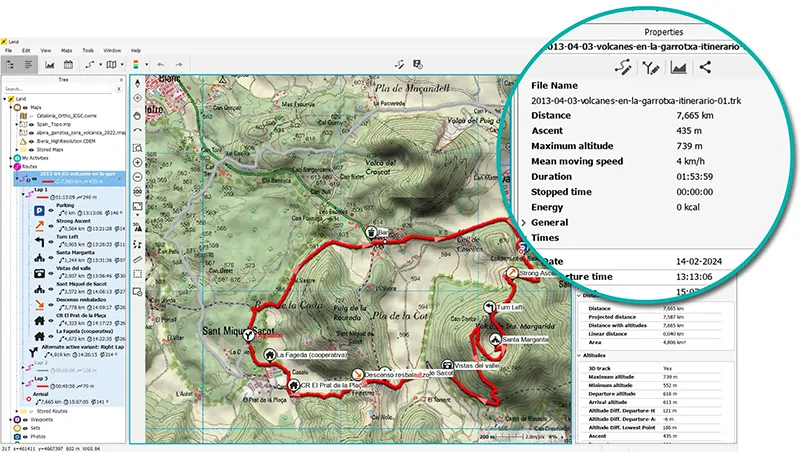
Distance: 7.66 km
Elevation Gain: 435 m
Maximum Altitude: 739 m
Speed: 4 km/h
Time: 1:53 min
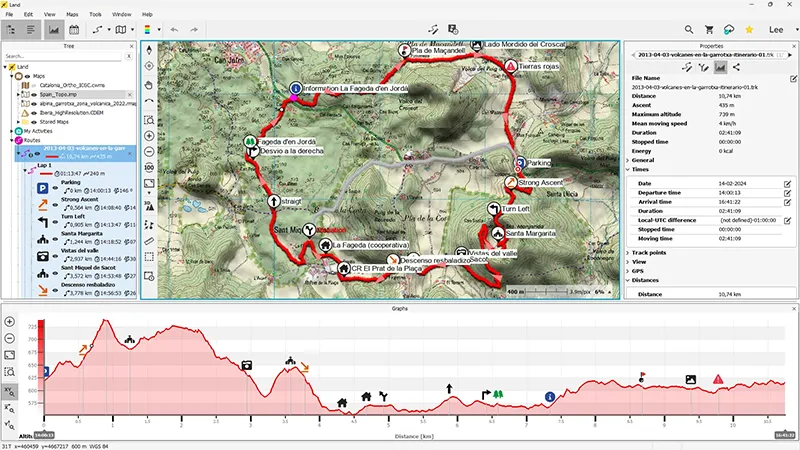
For me, the important thing about an alternative variant is the distance and time. In this case, comparing it with the long variant, it's 3 km and 50 minutes less. The elevation gain is the same because in this case, the steep ascent is at the beginning of the route and the final part is practically the same in both variants. We can see this more clearly in the altitude graph:
Long variant's altitude graph
Short variant's altitude graph
Another way to visually evaluate the difference in altitudes and slopes is with the color gradient of the track.
By altitude

By slope
Here are several videos that will be very helpful for analyzing your routes in various ways. Use the analysis type that best suits your activity.
Mini-Tuts

Route analysis with graphs

Route analysis with color gradient

Route analysis by laps
After this analysis, everything is clear for the outing. Now
all we have to do is upload the activity to the GPS or the TwoNav App and share it with our companions so they can start preparing.
Shall we go on?
Would you like to continue receiving tips like these and more information about Land 9?
Yes, I want to stay informed
 Secure Payment
 Free shipping on orders over €60 (EU)
 Hassle-free returns